Design thinking workshop
Senior UX Designer @ Thomson Reuters in 2019
Context
Thomson Reuters was starting to explore how to package and sell their APIs. To support that effort a colleague and I had the opportunity to plan and facilitate a design thinking workshop at the New York City office. We partnered with the Global Strategy team and hosted 10 legal business intelligence professionals to understand how they use their client dashboards and what data they are missing to accomplish their goals.
Planning
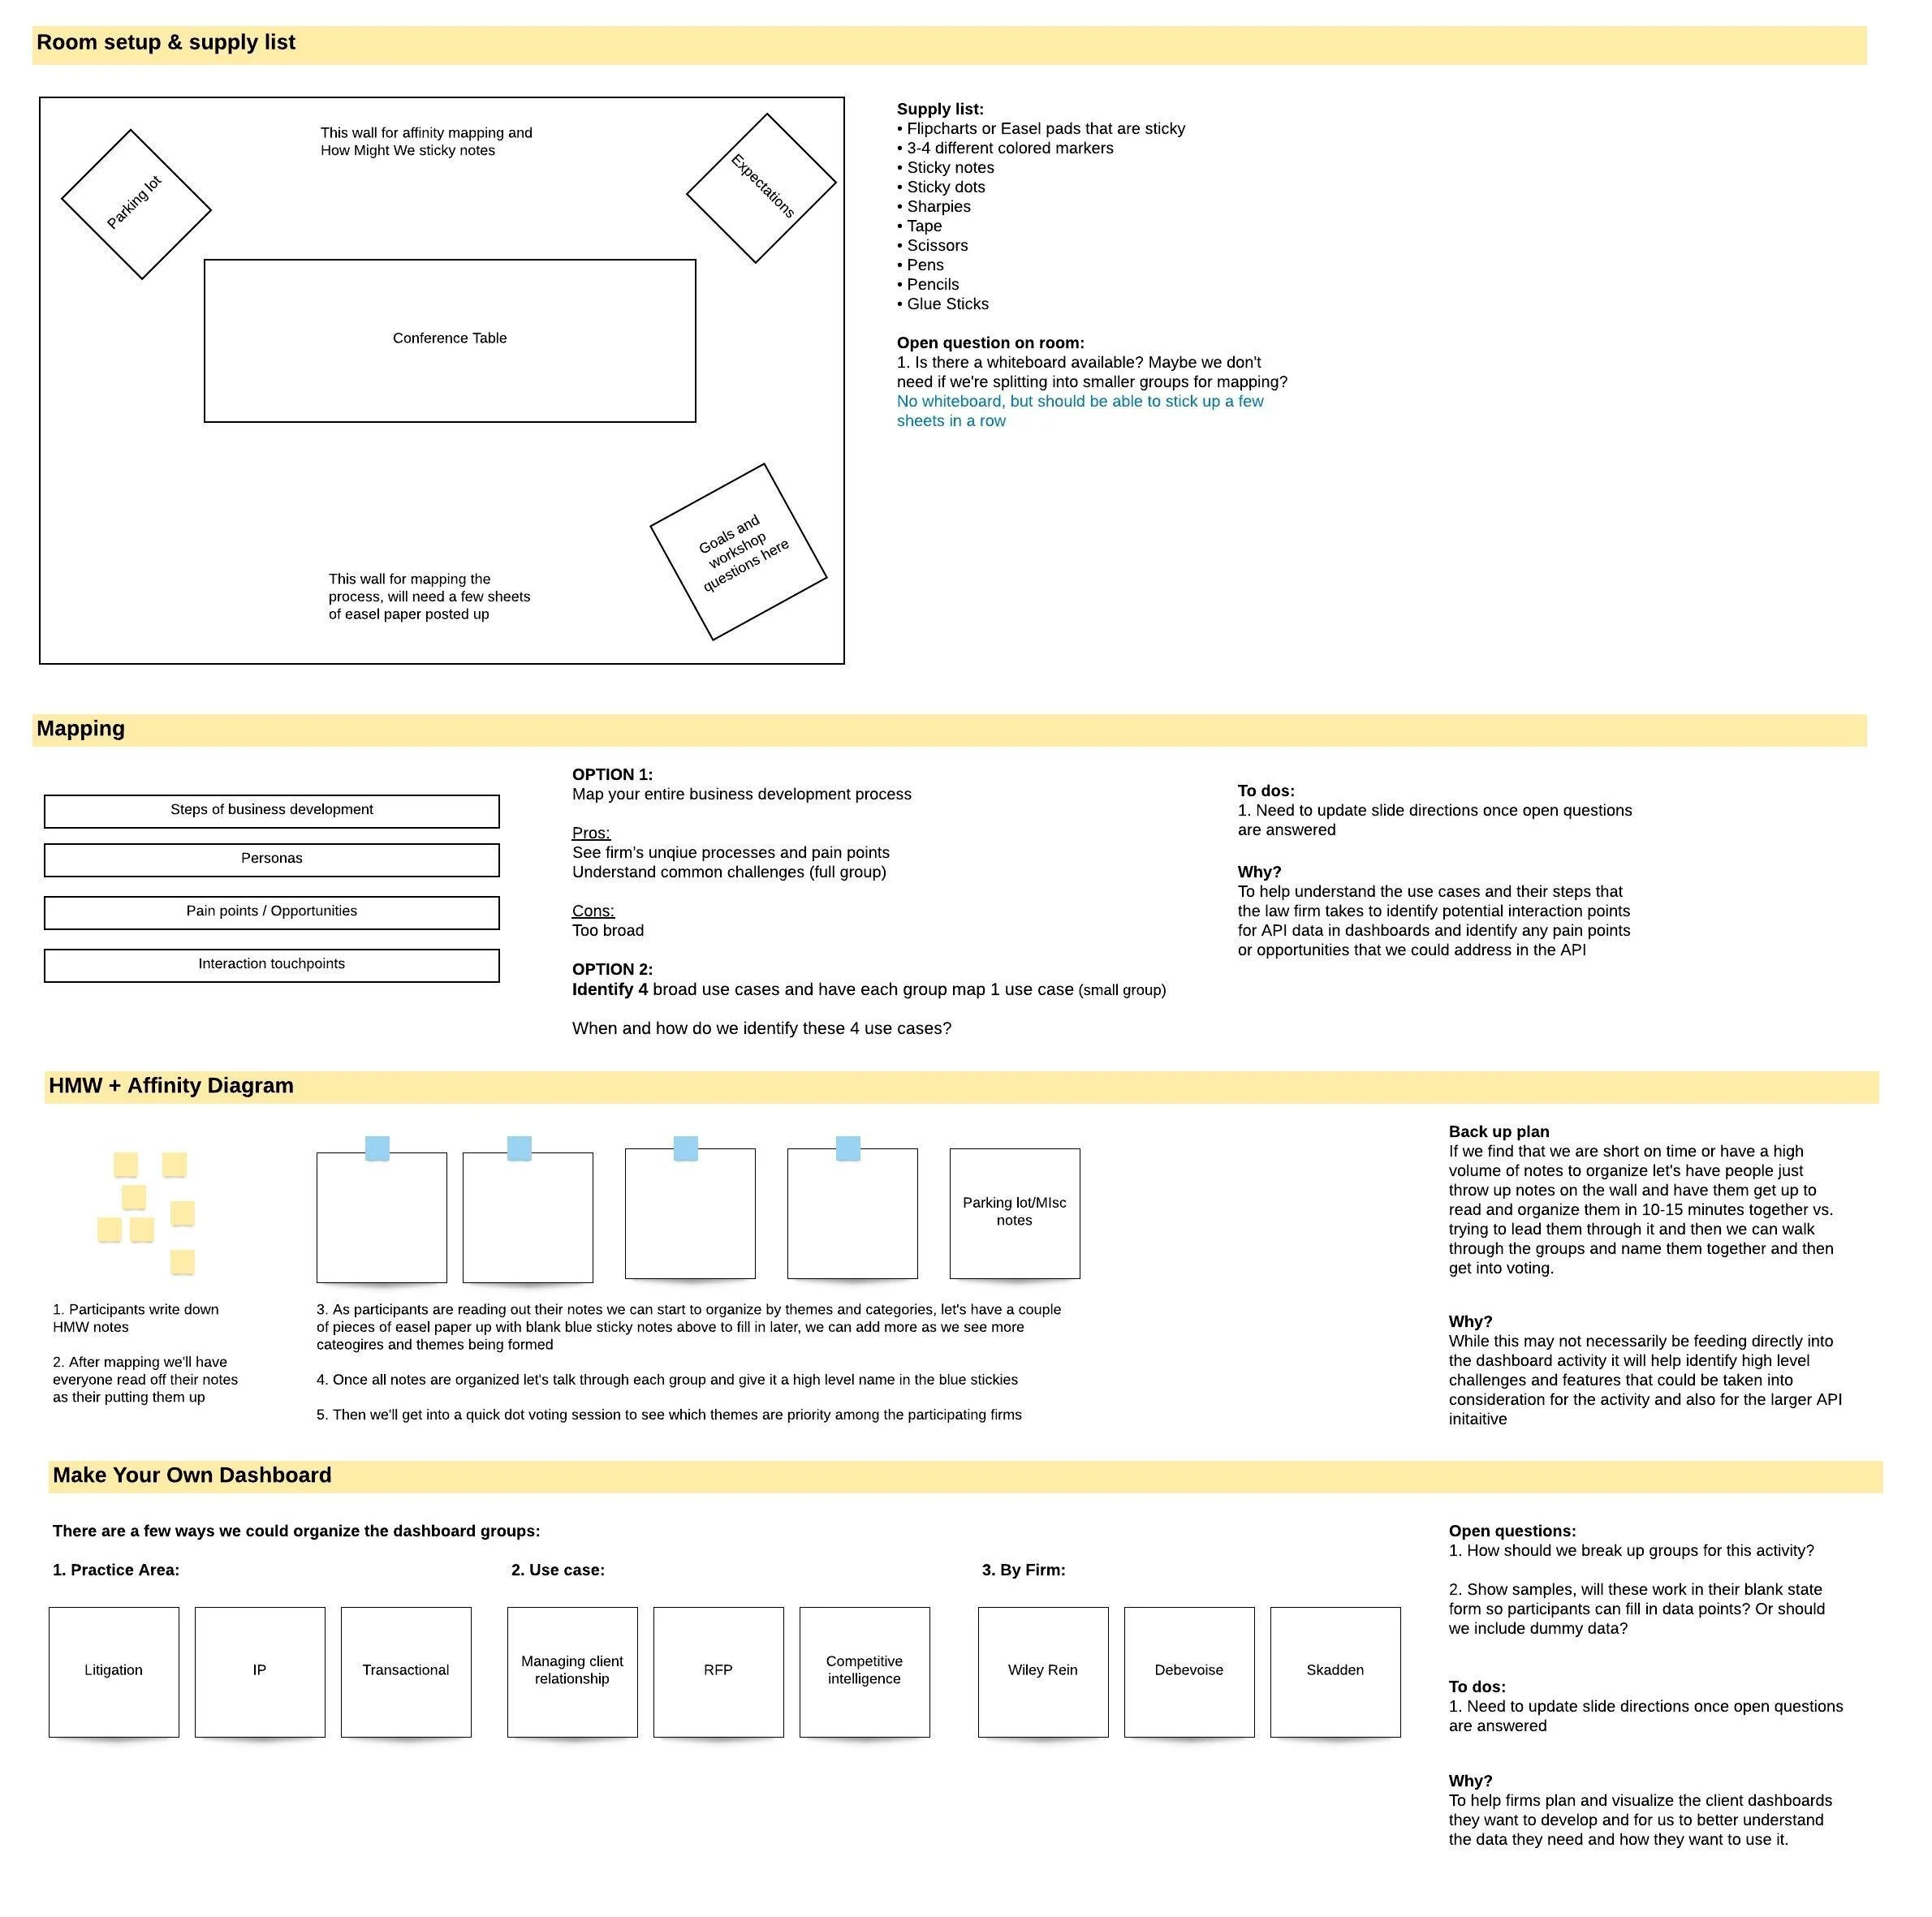
We spent weeks meticulously planning out the activities for the workshop utilizing design thinking best practices and heavily inspired by Jake Knapp’s “Sprint”. We mocked up how the room should be laid out to see how the activities would flow and to make sure we would be able to keep participants engaged and on schedule.
Workshop schedule
9:00 am
Introductions & icebreaker
We went around the room and asked participants to introduce themselves, what their role is, and what they hope to get out of today’s session. We also asked them to think of 1-3 words of how they would describe their firm today, 1-3 words on how they’d like to describe their firm in the future, and share with the group to help get us in a forward-thinking mindset.
9:30 am
Ask the experts
We asked our participants ahead of time to prepare a small presentation of what their client management processes are and if they use internal client dashboards. We then did a quick roundtable of those presentations to kick the day off and get a good background on how things work today.
10:30 am
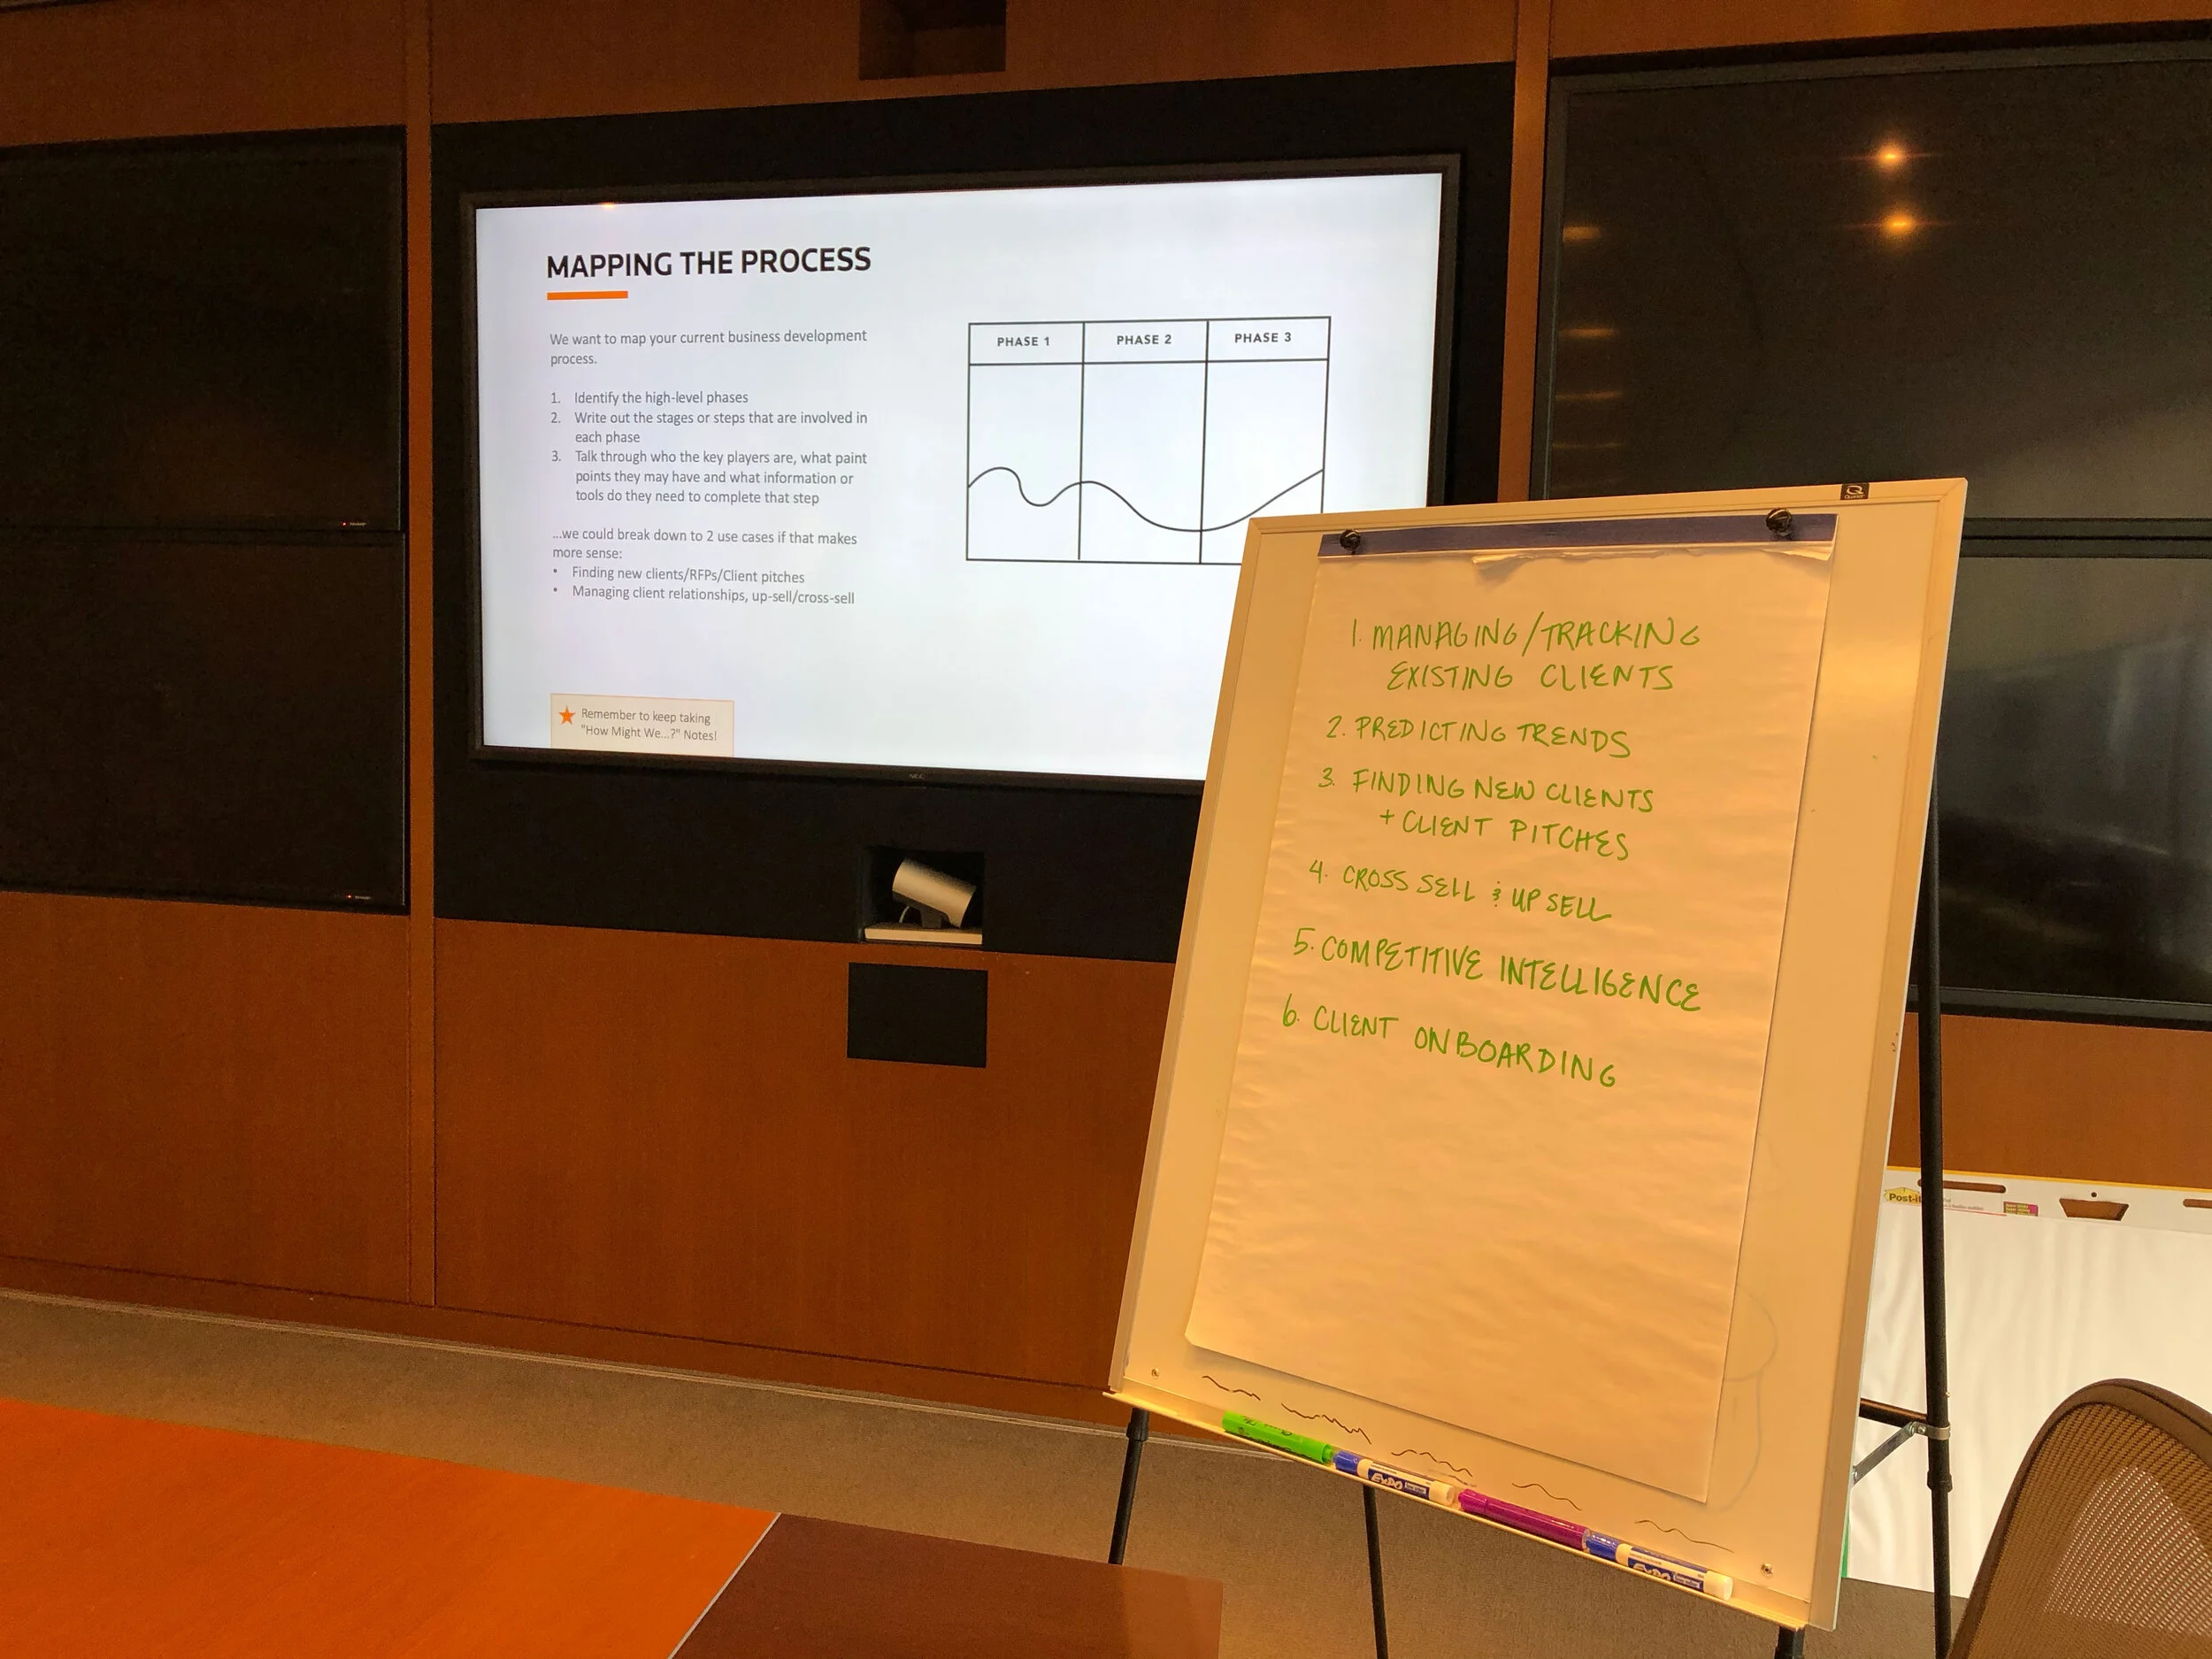
Mapping the process
From “ask the experts” activity we listed out the top use cases we heard and mapped out 2 of those use cases to understand the steps, pain points, at what point they might interact with dashboards or other tools, and any opportunities there might be to improve client management processes.
1:00 pm
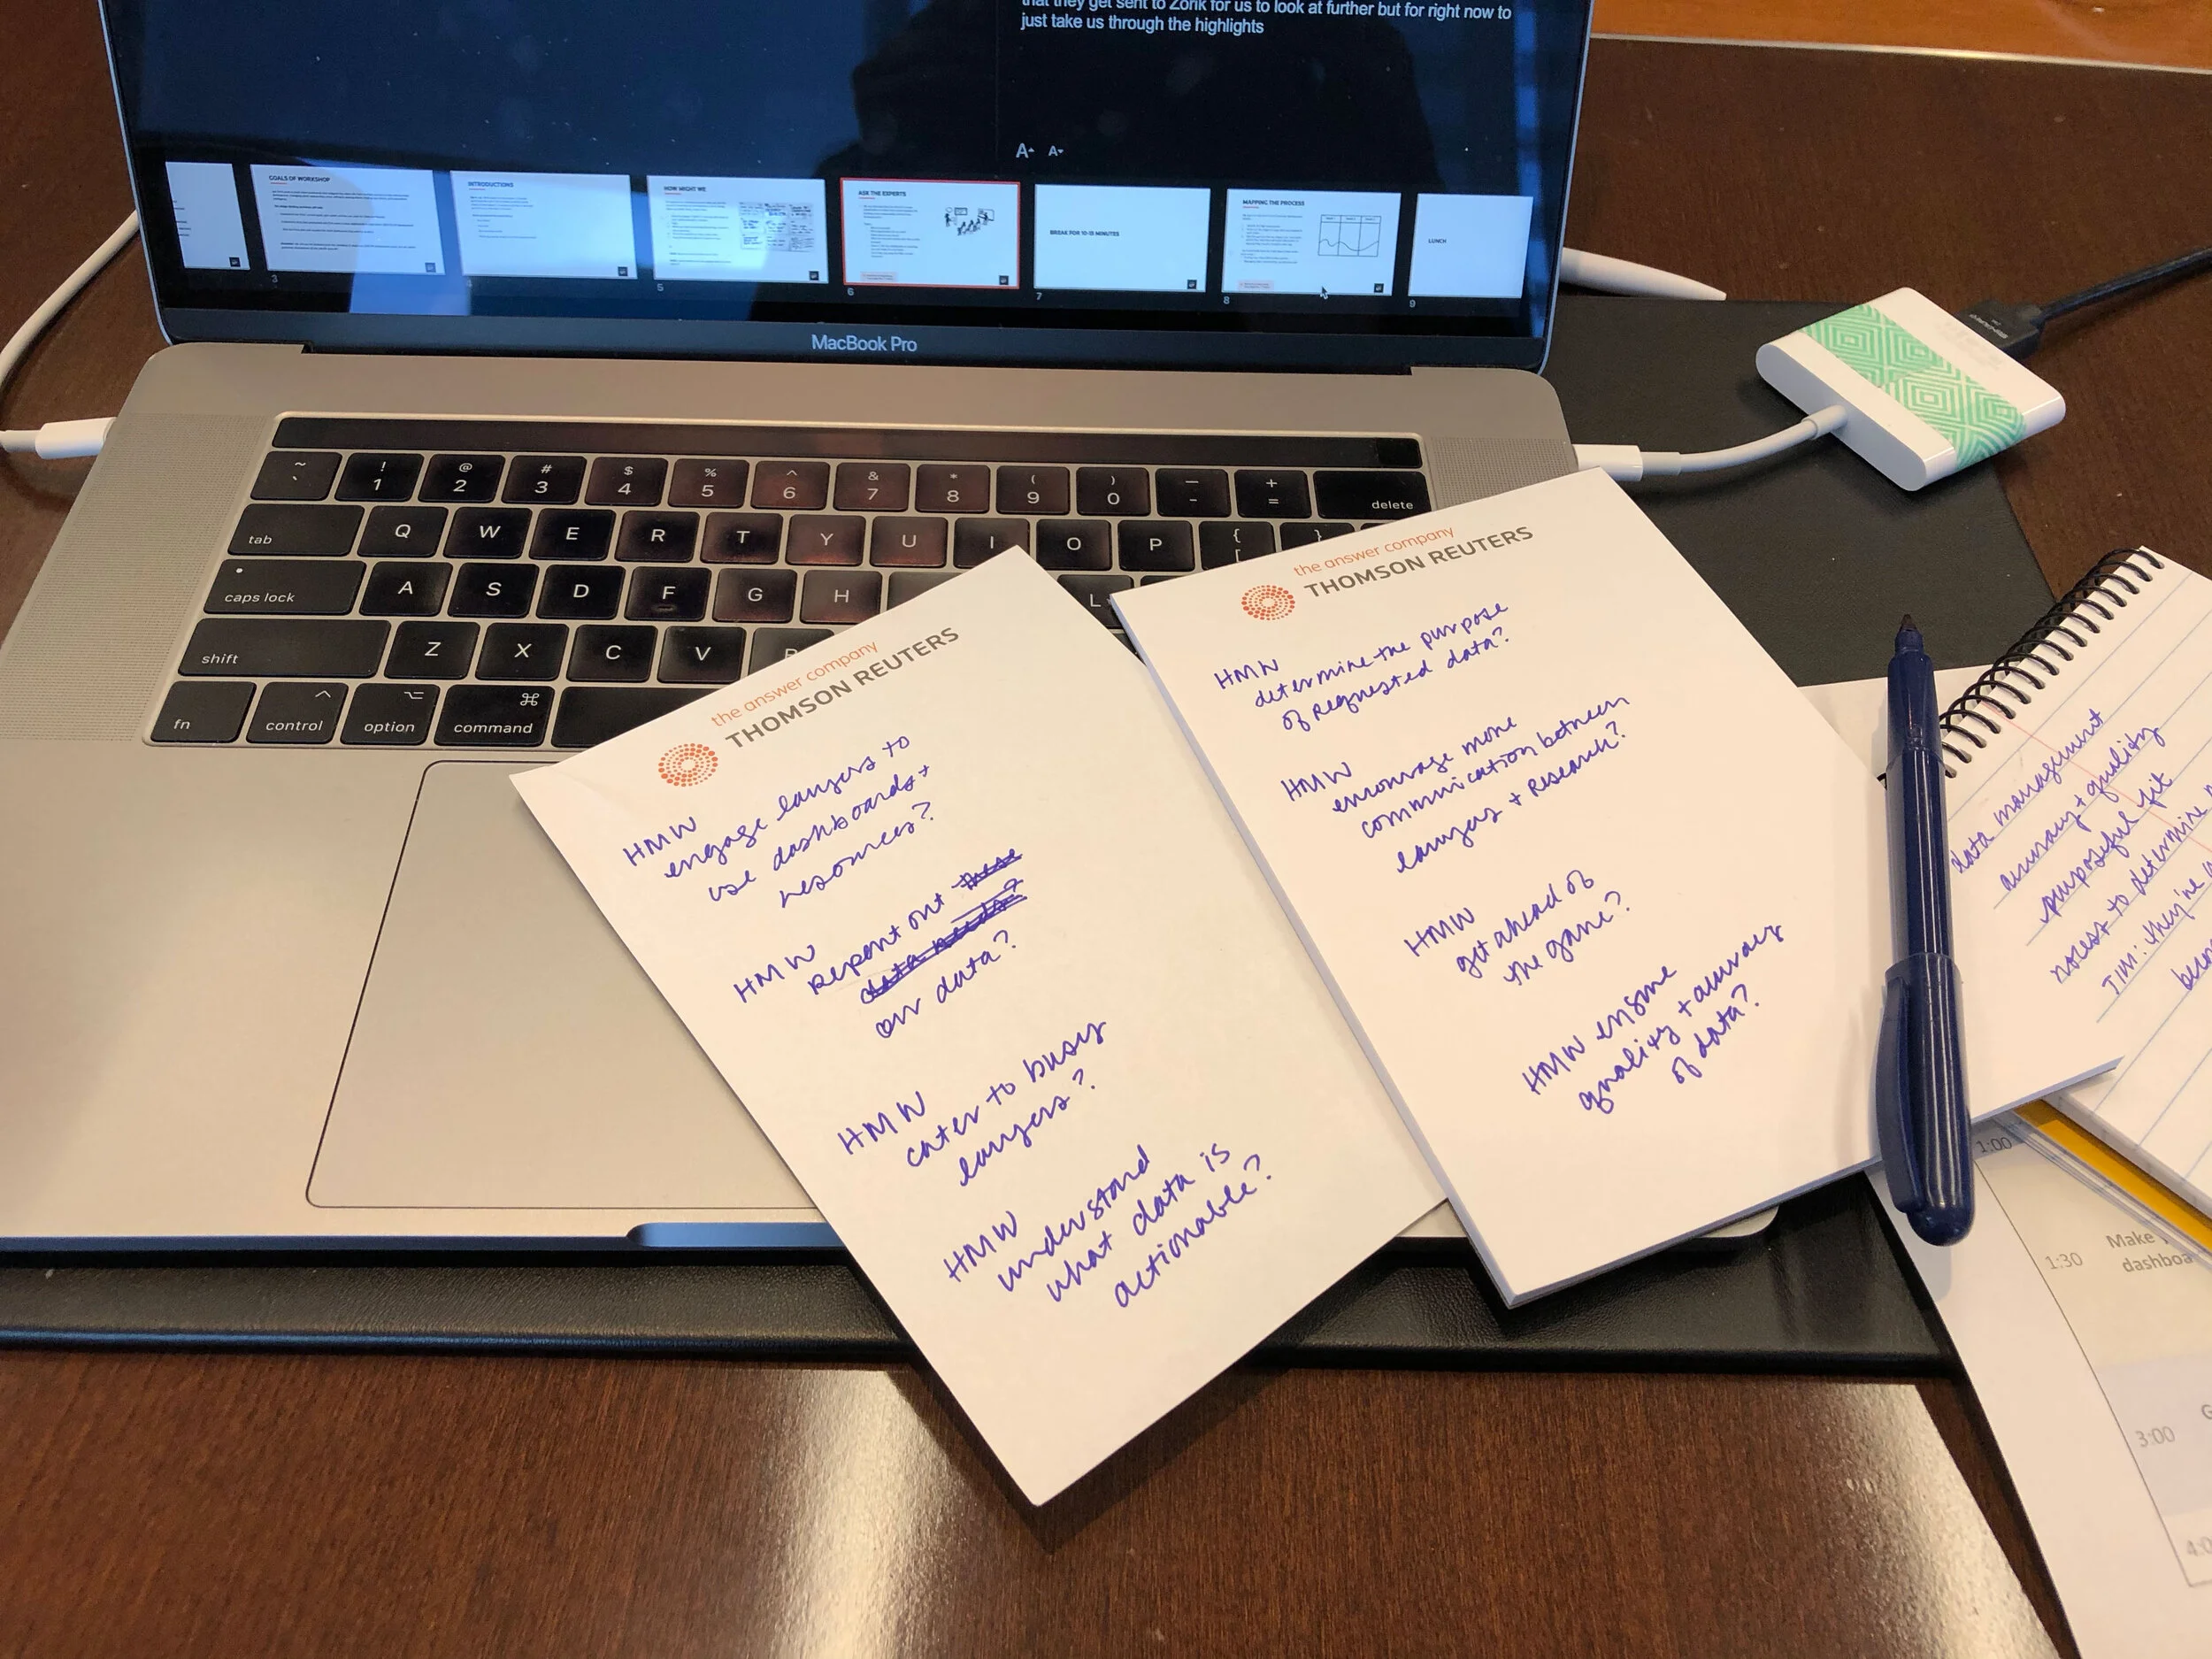
How might we statements & affinity mapping
During the morning sessions, we asked everyone to phrase questions and concerns into how might we statements on sticky notes. In this afternoon session, we read through them and started affinity mapping. Once we had them all up and grouped we titled the groups and dot voted to see which ones were seen as a higher priority.
1:30 pm
Create your own dashboard
We asked participants to pair up and choose a target step in our story map and a high priority how might we statement to build a paper prototype of a dashboard around. We gave them easel pads, paper templates of some basic data visualizations and other craft supplies. The goal of this activity was to help participants visualize the dashboards that would solve for steps in their process and what data or information they need to better help them accomplish their steps.
3:00 pm
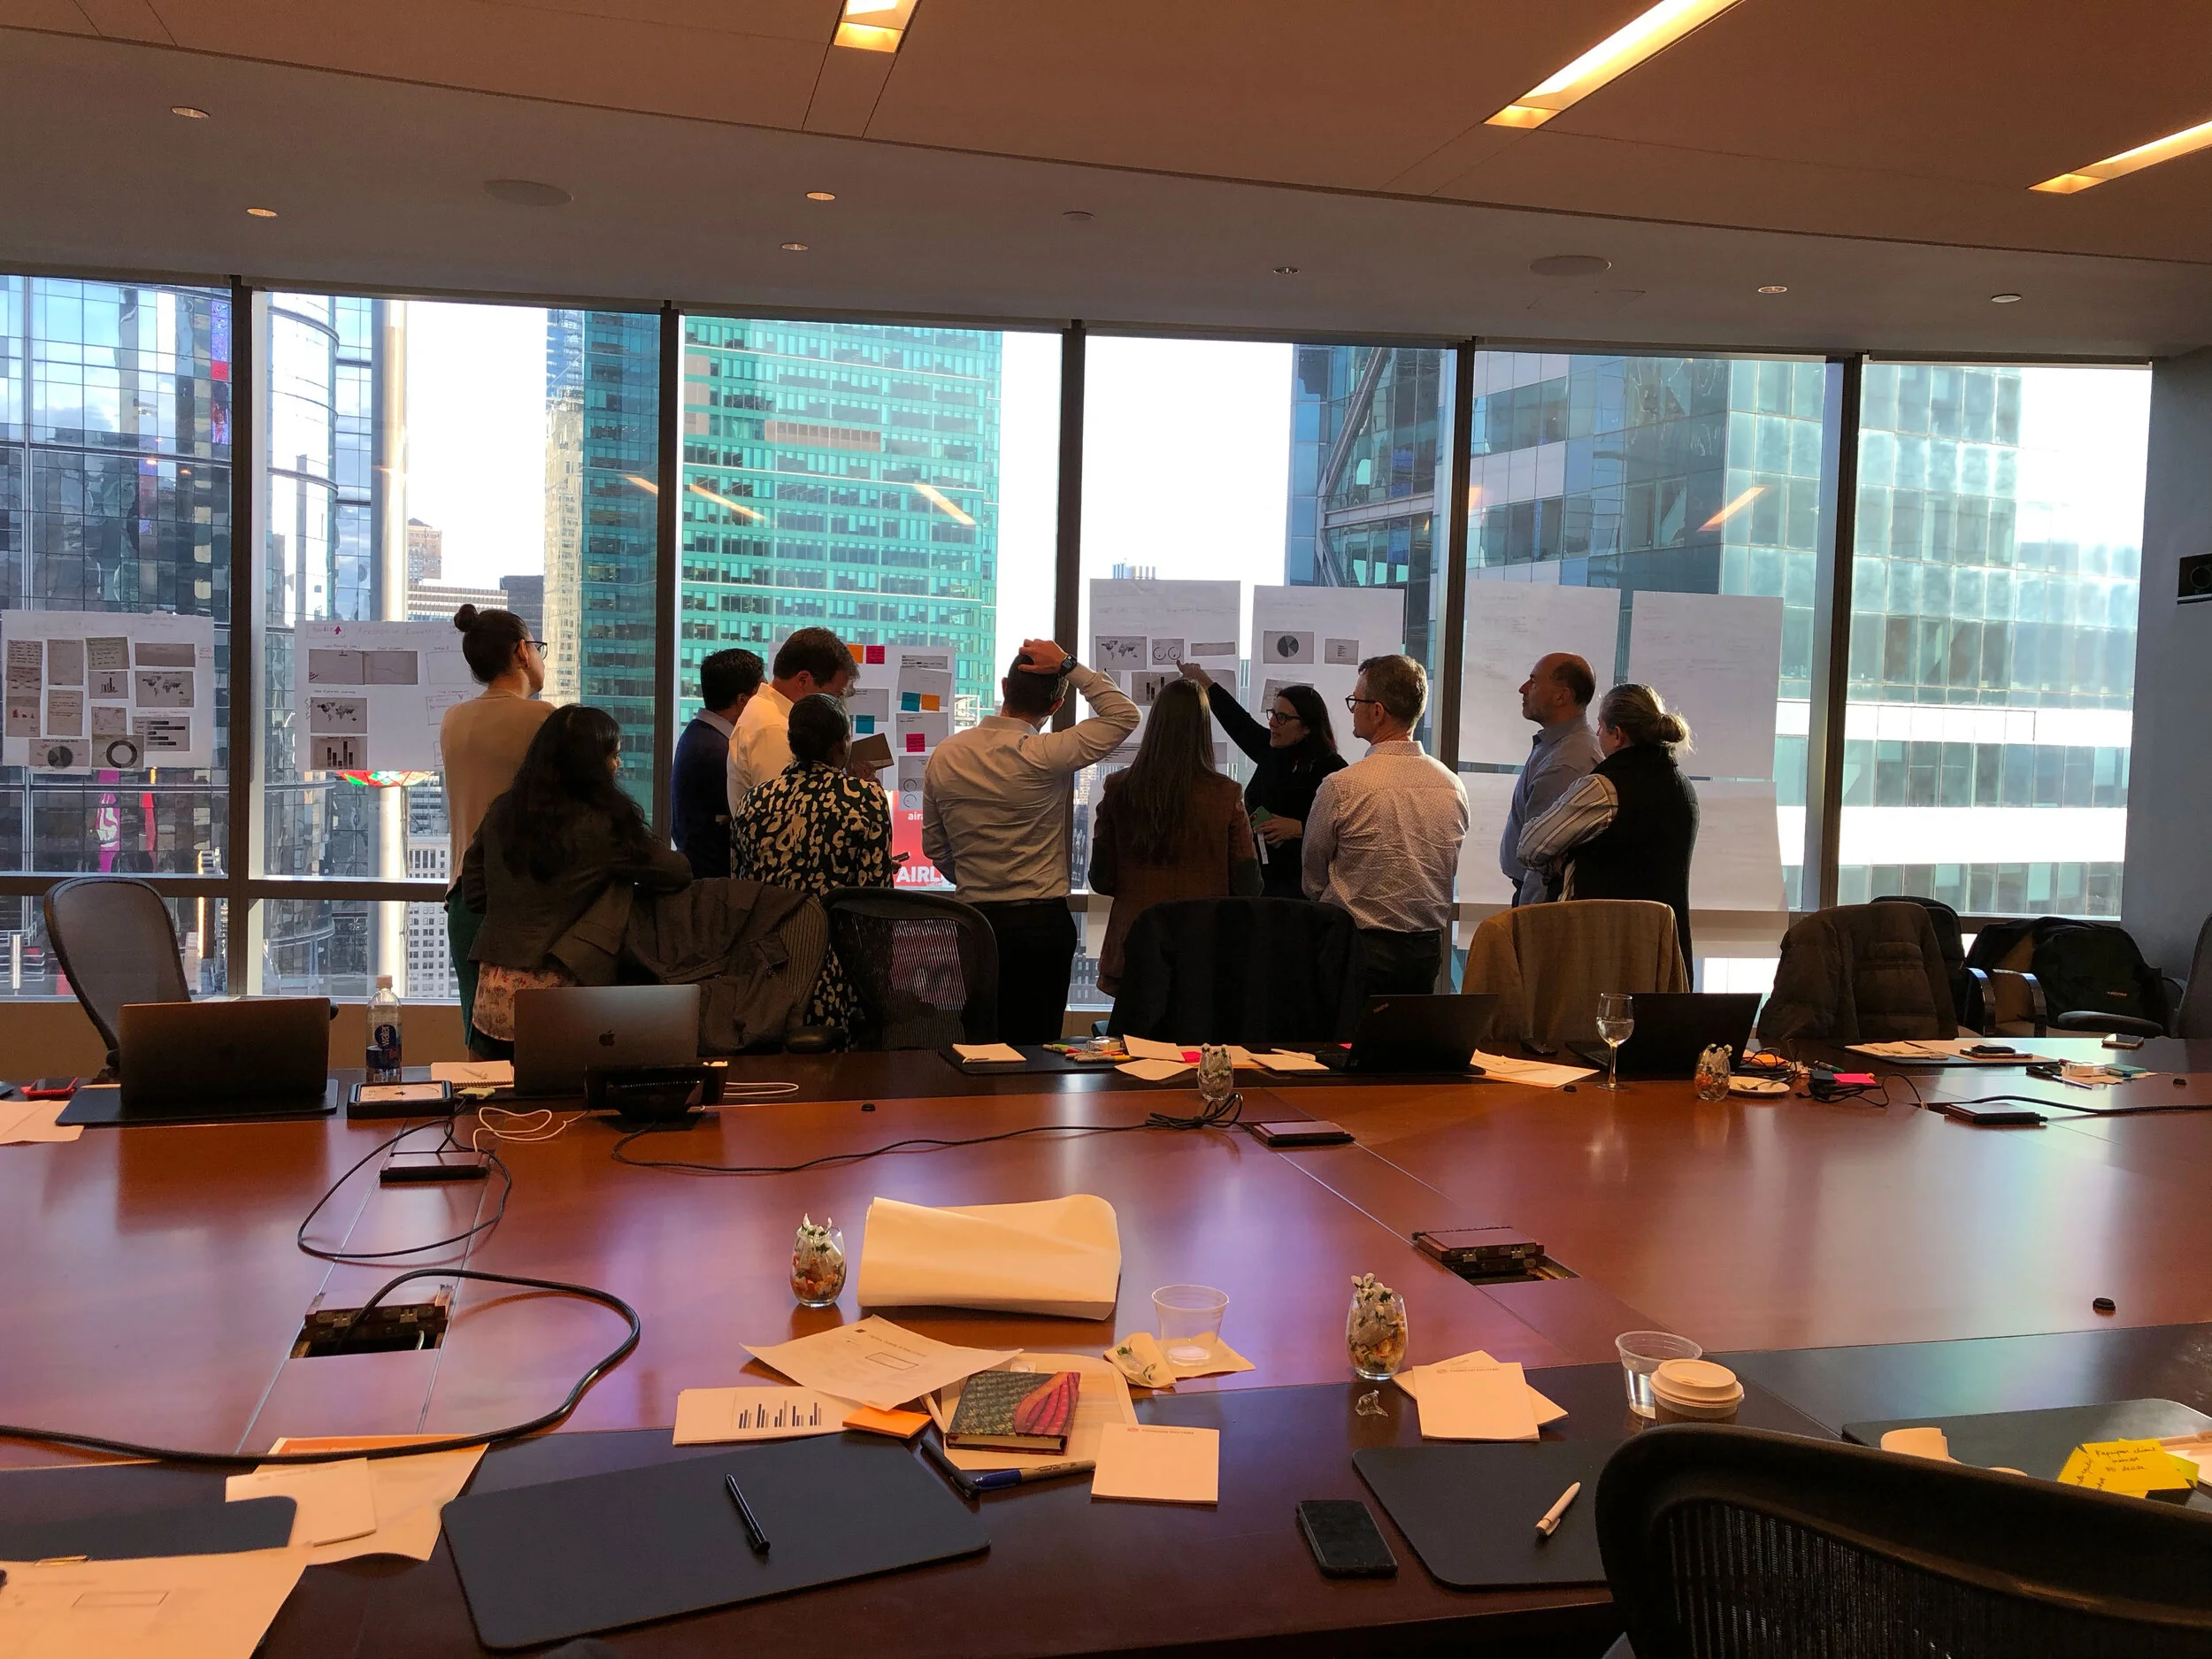
Gallery walk & voting
After dashboards were created we had everyone pin them up and had each group give a 5 minute presentation explaining their approach and data they included. After each group presented we had participants dot vote on what widgets/features/data they felt were high priority for their firms needs.
4:00 pm
Wrap & close
We thanked everyone for their time and participation and excused them. Then our team stayed behind and did a quick retro on how the day went and next steps.